Inventory XYZ Analysis Report
XYZ Inventory Analysis is a widely used inventory classification technique that categorizes products based on demand variability and consumption fluctuations. Unlike traditional inventory reports that only focus on stock quantities, XYZ analysis helps businesses understand how predictable or unpredictable product demand is over a specific period.
By analyzing historical inventory movement and calculating the coefficient of variation, products can be grouped into three categories: X, Y, and Z. This classification allows inventory managers to create better purchasing strategies, optimize stock levels, reduce inventory carrying costs, and improve demand forecasting accuracy.
XYZ analysis is especially valuable for businesses that manage large product catalogs and need to identify which products require close monitoring and which products have stable demand patterns.
X Items: X items products considered in very little demand variation.
Y Items: Y items products considered in fluctuating demand.
Z Items: Z items products considered in highest demand variations.
Why Businesses Use XYZ Analysis
Inventory managers often struggle to determine which products require close monitoring and which products can be managed with standard replenishment processes.
XYZ analysis helps organizations:
- Improve demand forecasting.
- Optimize inventory investment.
- Reduce excess stock.
- Prevent stock shortages.
- Improve warehouse efficiency.
- Support procurement planning.
- Increase inventory visibility.
- Improve supply chain performance.
- Identify unstable product demand.
- Support strategic inventory decisions.
Benefits of Inventory XYZ Analysis Report
| Benefit | Description |
| Demand Variability Analysis | Understand demand fluctuations across products. |
| Better Inventory Planning | Improve purchasing and replenishment decisions. |
| Stock Optimization | Maintain optimal inventory levels. |
| Improved Forecasting | Enhance forecasting accuracy using demand patterns. |
| Reduced Carrying Costs | Lower inventory holding expenses. |
| Enhanced Visibility | Gain deeper insights into product demand behavior. |
| Improved Procurement | Make data-driven purchasing decisions. |
| Better Warehouse Management | Allocate warehouse resources effectively. |
| Strategic Inventory Control | Focus efforts on high-risk inventory categories. |
| Data-Driven Decision Making | Use analytical insights for inventory management. |
Features
1) Stock XYZ Analysis Report
User can check fast moving, slow moving and non moving product for stock.
2) Stock XYZ XLS Report
User can also print XYZ analysis report in XLS format.
3) Different Filters for XYZ Report
User can use different filters like product and product category, date start, date end and company for XYZ report.
4) Current Stock & Coefficient Variation % for Stock
User can see current stock and coefficient of variation percentage for stock.
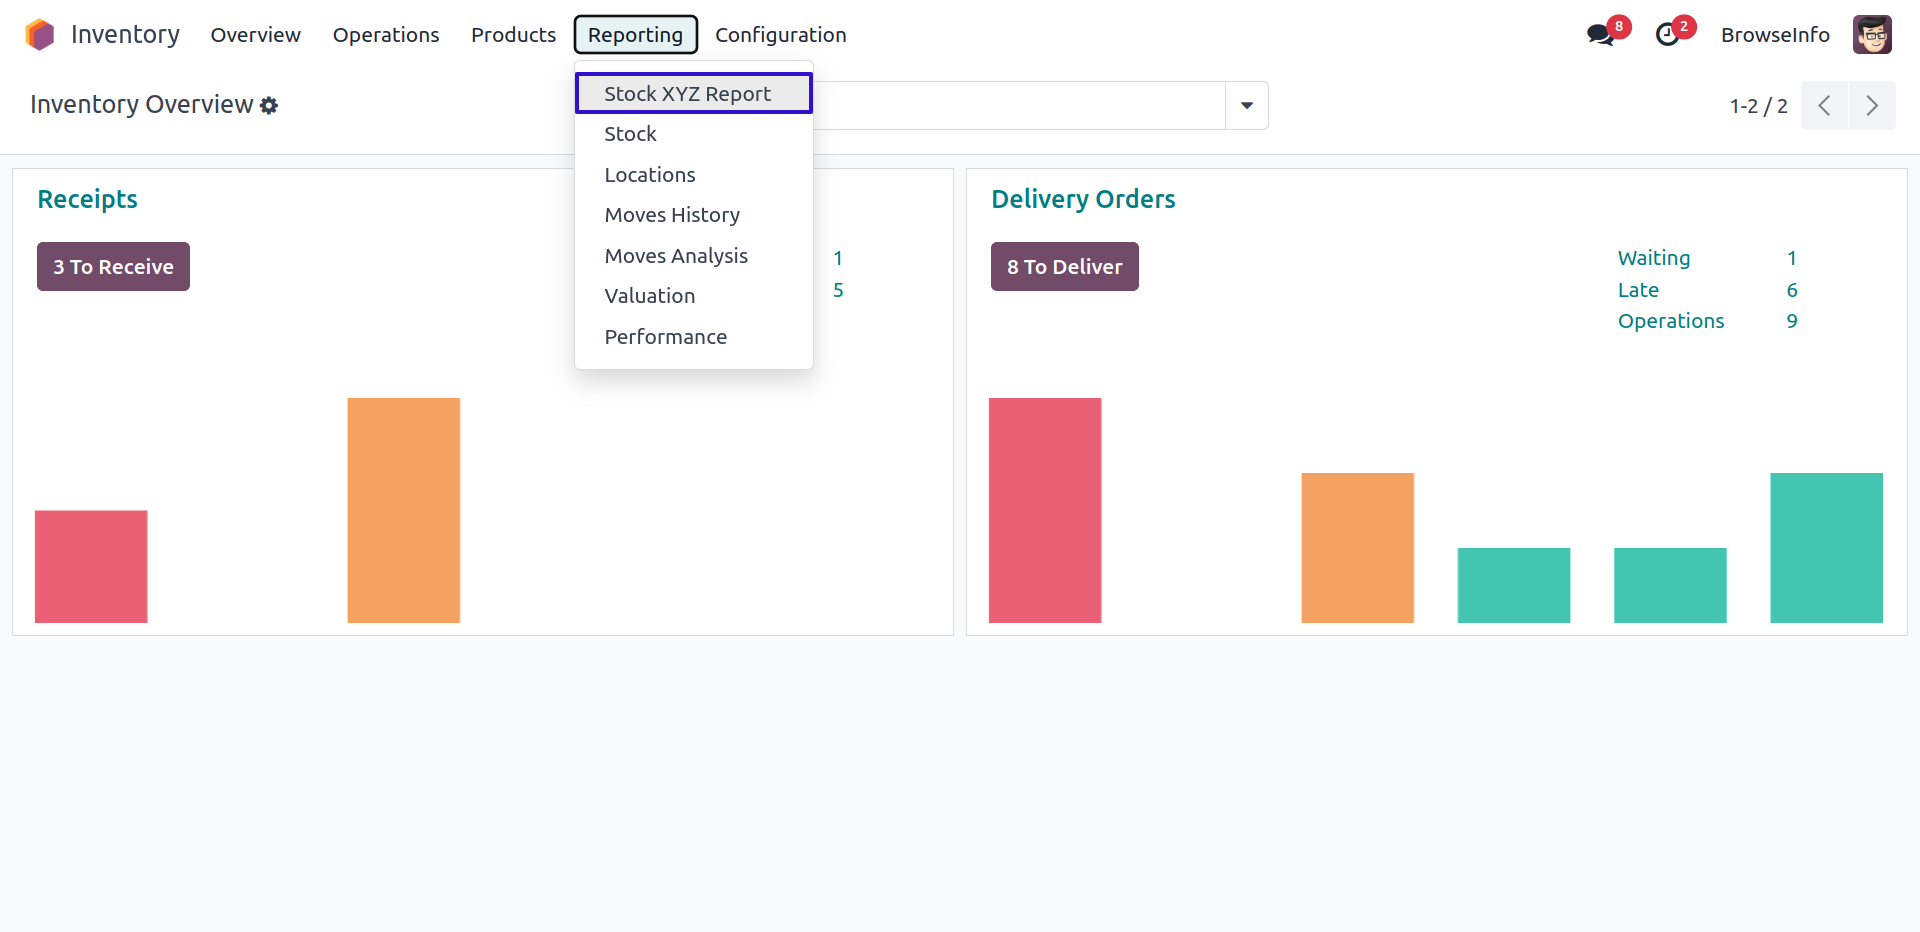
Stock XYZ Report Menu
Under Inventory > Reporting menu user can see "Stock XYZ Report" menu.
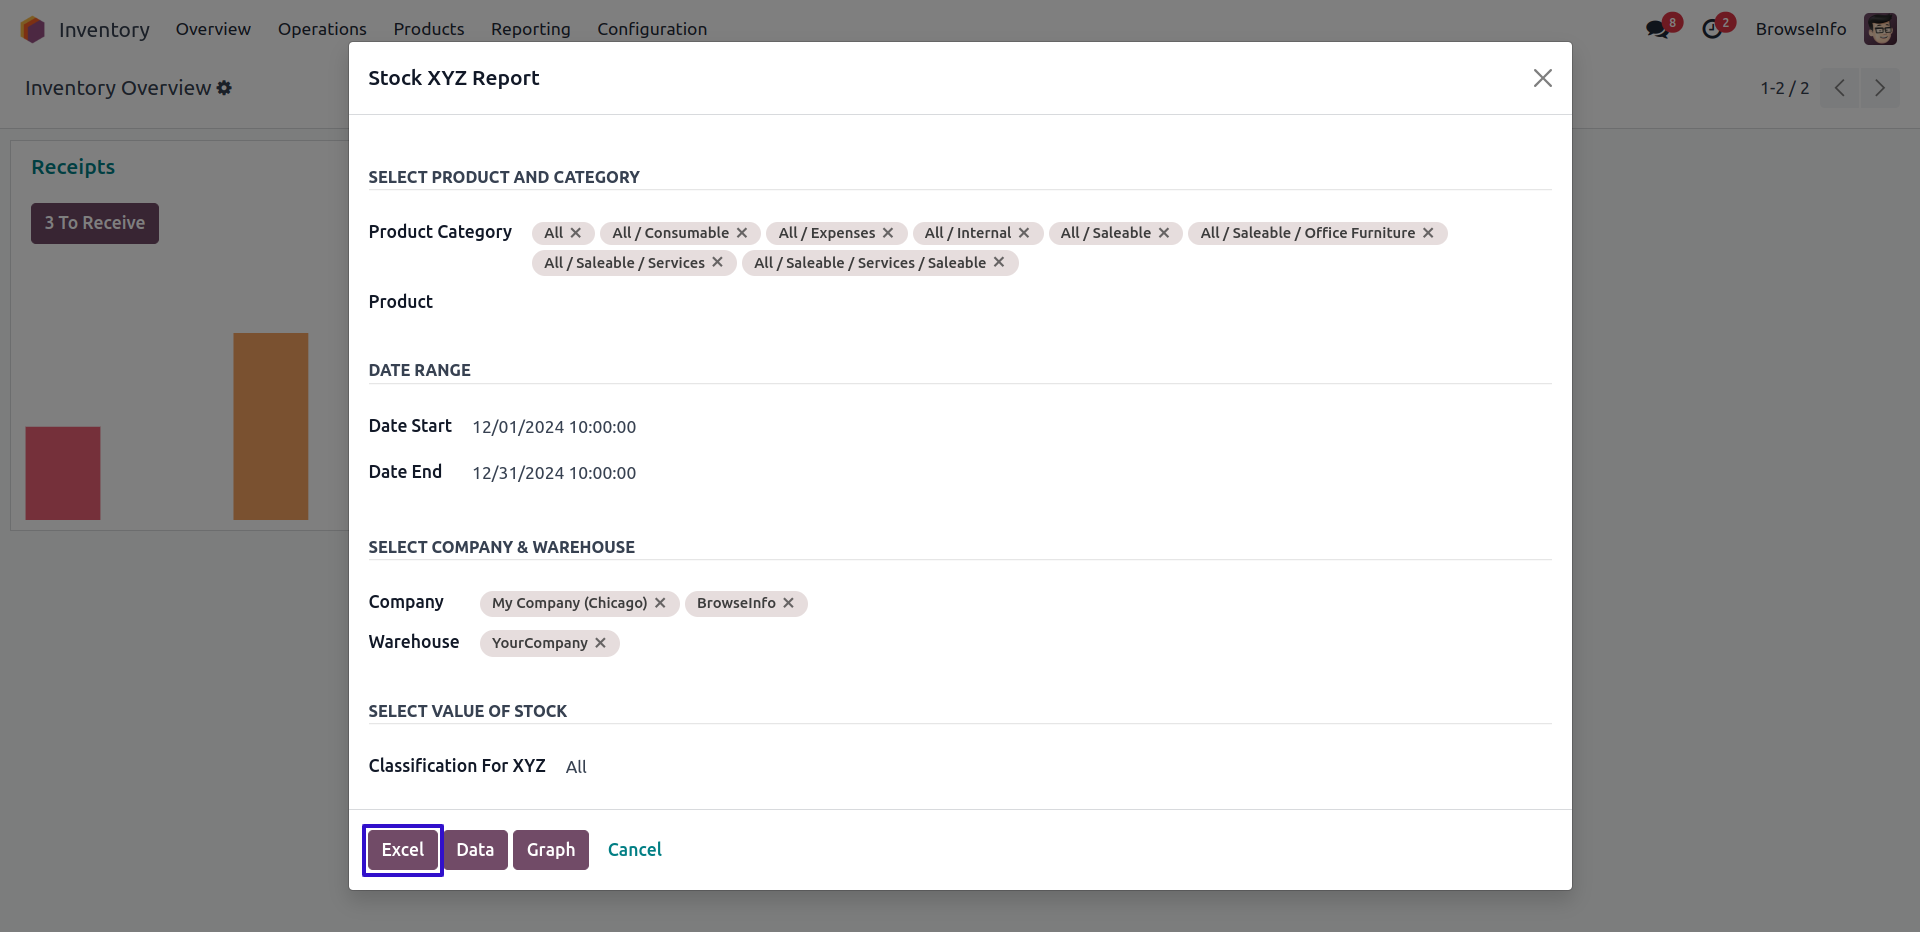
On clicking menu new wizard will open user can apply different filters like product categories, products, date start, date end and company, Also can select different XYZ classification type.
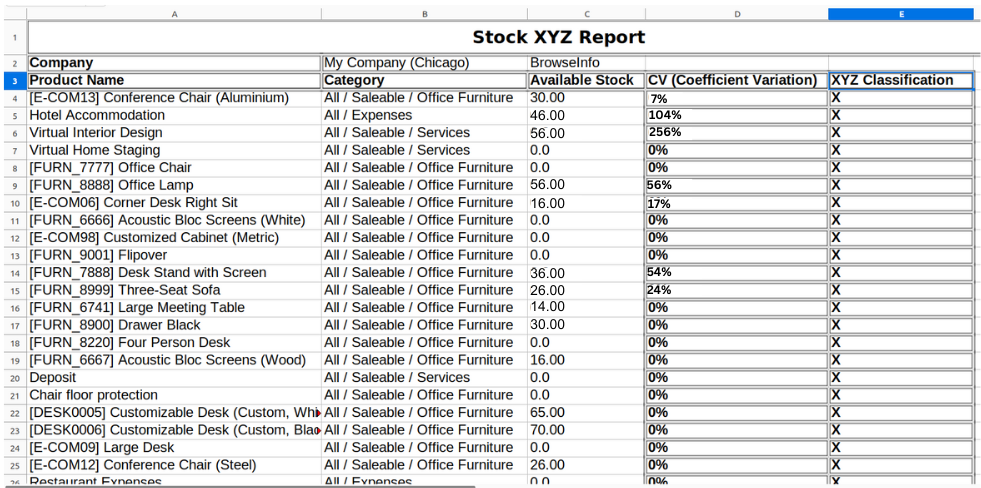
Stock XYZ Excel Report
On clicking the "EXCEL REPORT" button user can see generated XYZ excel report as below the image.
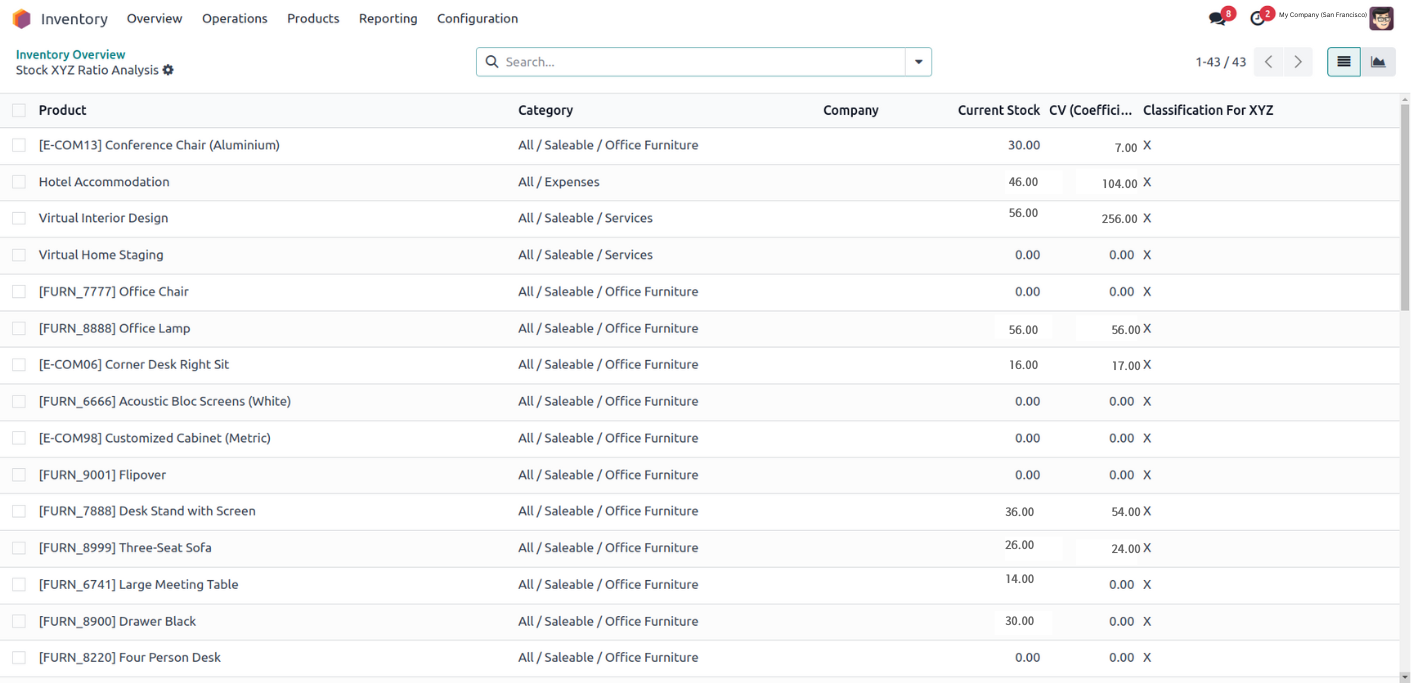
Stock XYZ Analysis Report
On clicking "VIEW DATA" button user can see XYZ analysis report.
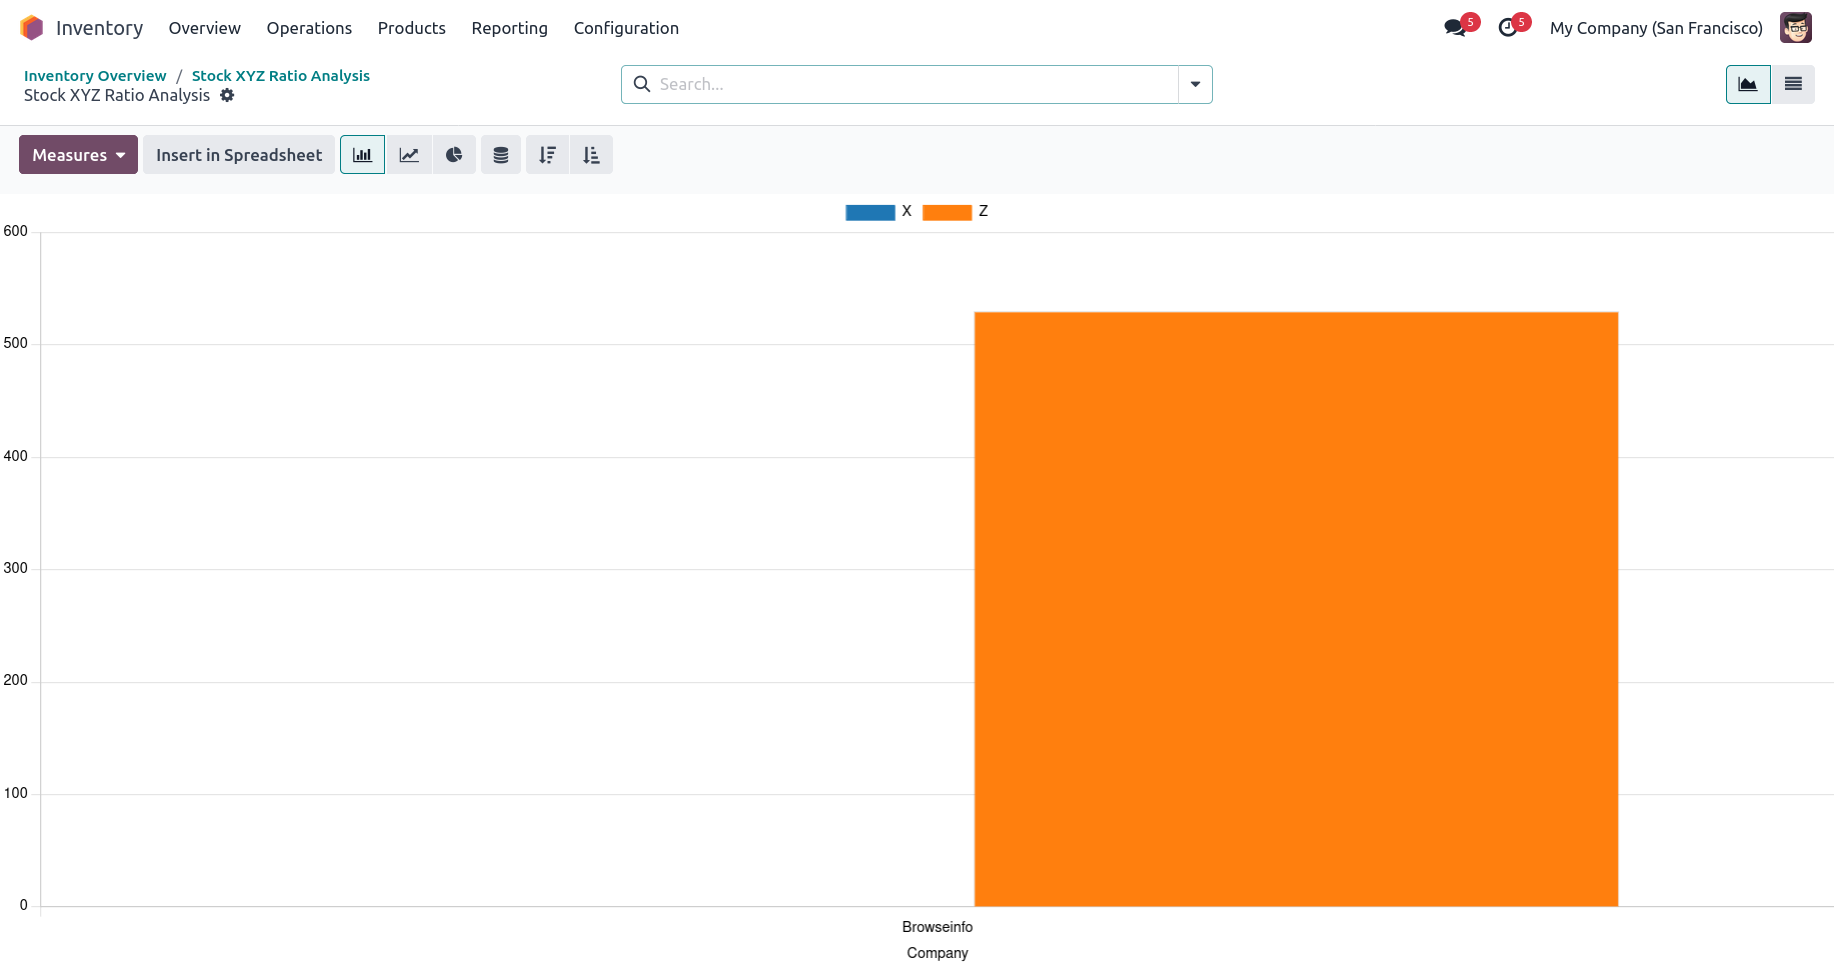
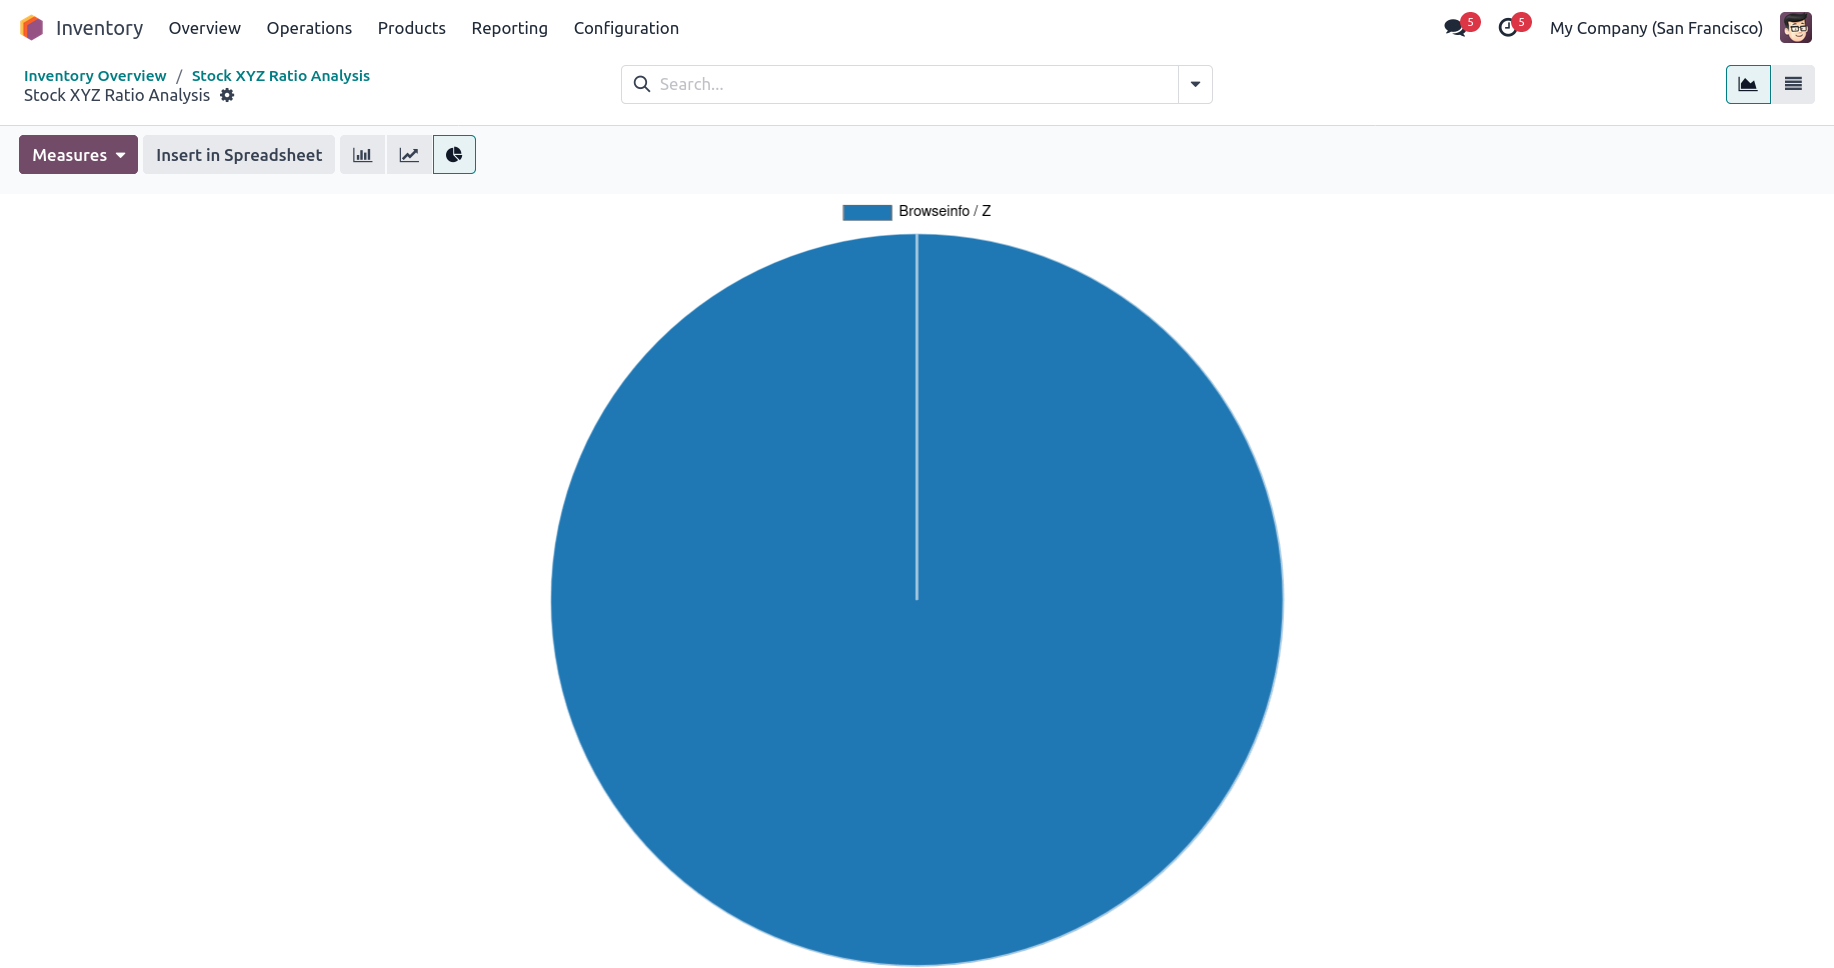
Stock XYZ Graph Report
On clicking "VIEW GRAPH" button user can see graph view for XYZ analysis.
How XYZ Analysis Supports Inventory Forecasting
Forecasting future demand is one of the most challenging aspects of inventory management. Businesses often experience difficulties when product demand changes unexpectedly.
The Inventory XYZ Analysis Report helps improve forecasting by identifying products with:
- Stable demand patterns.
- Seasonal demand fluctuations.
- Unpredictable demand behavior.
This information allows inventory planners to apply different forecasting methods for each product category and improve overall inventory accuracy.
For example:
| Category | Forecasting Approach |
| X Items | Long-term forecasting |
| Y Items | Seasonal forecasting |
| Z Items | Short-term forecasting with safety stock |
This targeted approach helps reduce forecasting errors and inventory risks.
Inventory Optimization Through XYZ Classification
Inventory optimization requires balancing product availability with inventory investment. Keeping excessive stock increases carrying costs, while insufficient inventory can result in lost sales.
XYZ analysis supports inventory optimization by helping businesses:
- Identify stable products.
- Detect unpredictable demand items.
- Improve stock allocation.
- Reduce excess inventory.
- Improve service levels.
- Increase inventory efficiency.
By understanding product demand variability, organizations can establish more effective inventory policies.
Industries That Benefit From XYZ Analysis
The Inventory XYZ Analysis Report can be used across multiple industries.
Manufacturing Industry
Manufacturers can classify raw materials and finished goods according to demand variability and improve production planning.
Retail Industry
Retail businesses can analyze customer purchasing patterns and optimize product availability.
Wholesale Distribution
Distributors can improve inventory turnover and manage stock levels across warehouses.
E-Commerce Businesses
Online stores can forecast demand more accurately and reduce inventory shortages.
Pharmaceutical Industry
Healthcare organizations can classify medicines and medical products based on demand behavior.
Automotive Industry
Automotive companies can manage spare parts inventory more efficiently using XYZ classification.
Key Metrics Used in XYZ Analysis
The report calculates important inventory metrics that help businesses evaluate demand patterns.
| Metric | Purpose |
| Current Stock | Available inventory quantity. |
| Demand Variation | Measures fluctuations in demand. |
| Coefficient of Variation (%) | Determines product classification. |
| Historical Consumption | Evaluates past inventory movement. |
| Product Category | Groups products for analysis. |
| Classification Result | Identifies X, Y, or Z category. |
These metrics provide valuable insights into inventory performance and product demand behavior.
Graphical Analysis for Better Decision Making
The Inventory XYZ Analysis Report includes graphical views that help users quickly interpret inventory data.
Users can view:
- Bar charts.
- Analytical graphs.
- Demand comparison charts.
- Product classification summaries.
- Inventory distribution visuals.
Visual reporting makes it easier to identify inventory trends and demand fluctuations without manually reviewing large datasets.
Excel Export for Advanced Reporting
Many businesses require inventory reports for management reviews, audits, and strategic planning meetings.
The Excel export functionality allows users to:
- Download detailed XYZ analysis reports.
- Share inventory data with stakeholders.
- Perform additional calculations.
- Create custom reports.
- Maintain historical inventory records.
This feature improves reporting flexibility and supports business decision-making processes.
Business Impact of XYZ Analysis
Organizations implementing XYZ inventory analysis often experience measurable improvements in inventory performance.
Some common benefits include:
- Improved stock availability.
- Better demand forecasting accuracy.
- Reduced inventory holding costs.
- Enhanced procurement planning.
- Improved warehouse efficiency.
- Faster inventory decision-making.
- Reduced stock obsolescence.
- Better inventory visibility.
- Increased operational efficiency.
- Improved customer satisfaction.
The Inventory XYZ Analysis Report provides the analytical insights needed to transform inventory data into actionable business intelligence.
Why Choose Inventory XYZ Analysis Report for Odoo?
The Inventory XYZ Analysis Report extends standard Odoo inventory reporting by providing advanced demand variation analysis and product classification capabilities. It enables organizations to understand inventory behavior at a deeper level and supports data-driven inventory management.
Key reasons businesses choose this solution include:
- Easy-to-use reporting interface.
- Automated XYZ product classification.
- Detailed demand variation analysis.
- Current stock visibility.
- Coefficient of variation calculations.
- Advanced filtering options.
- Graphical inventory analysis.
- Excel export functionality.
- Multi-company support.
- Better inventory planning capabilities.
The report transforms raw inventory data into meaningful business insights that help organizations improve stock management and operational performance.
Conclusion
The Inventory XYZ Analysis Report Odoo App is a powerful inventory analytics solution designed to help businesses understand product demand variability and improve inventory decision-making. By classifying products into X, Y, and Z categories based on demand fluctuations, organizations can gain valuable insights into inventory behavior, optimize stock levels, improve forecasting accuracy, and reduce inventory-related costs.
With features such as demand variation analysis, coefficient of variation calculations, graphical reporting, Excel export functionality, product and category filtering, and multi-company support, the application provides a complete framework for advanced inventory analysis. Businesses can identify stable products, monitor fluctuating demand patterns, and develop inventory strategies that align with actual market requirements.
Whether managing a retail business, manufacturing operation, wholesale distribution network, eCommerce store, or multi-warehouse environment, the Inventory XYZ Analysis Report helps organizations improve inventory visibility, enhance supply chain planning, and make smarter inventory decisions. By leveraging data-driven insights and demand-based product classification, businesses can achieve greater inventory efficiency, better customer service, and long-term operational success.
